
Modern cartography is no longer limited to hand-drawn sketches or simple visual references. Today, maps are built on sophisticated data systems, spatial analytics, and intentional design. Understanding how a modern map is created helps reveal why maps are powerful tools for decision-making in fields such as urban planning, environmental management, disaster response, transportation, and business strategy.
This article outlines the end-to-end process of contemporary mapmaking, from raw data collection to the final visual layout.
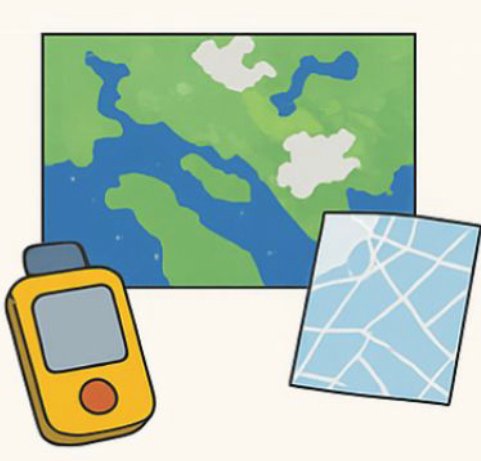
- Data Collection: Building the Foundation
Every modern map begins with data. The quality, accuracy, and completeness of this data directly influence the usefulness of the final output.
Common data sources include:
- Satellite and aerial imagery
- GPS surveys and ground measurements
- Remote sensors and IoT devices
- Government datasets (land use, boundaries, demographics)
- Field observations collected manually
This stage focuses on gathering reliable spatial and attribute information that represent real-world features.
- Processing in GIS: Organizing the Information
Once the data is collected, it is imported into a Geographic Information System (GIS). GIS software is the core engine of modern cartography, enabling users to store, manage, edit, and structure complex spatial information.
In GIS, data is organized into layers—such as roads, elevation, hydrography, vegetation, land use, and administrative boundaries. Each layer can be independently analyzed and combined to represent different aspects of geographic reality. - Spatial Analysis: Extracting Insight
GIS is not merely a storage tool; it is an analytical platform. With spatial analysis, users can uncover patterns, relationships, and trends that are invisible in raw data.
Examples of spatial analysis include:
- Identifying flood-risk zones based on elevation and rainfall patterns
- Measuring population density and distribution
- Modeling transportation flows and travel times
- Detecting land-use changes through multitemporal imagery
- Optimizing routes for logistics and emergency services
This stage transforms data into actionable insights.
- Cartographic Design: Turning Analysis into Communication
After the analytical stage, cartographers translate complex findings into a clear and meaningful visual message. Good map design requires decisions about:
- Color schemes and symbology
- Typography and label hierarchy
- Map scale and projection
- Visual balance, contrast, and readability
The goal is to communicate information effectively, not to overwhelm the viewer.
- Final Layout: Preparing for Presentation
The last stage is assembling all map elements into a polished, publication-ready layout. This includes placing:
- Title
- Legend
- Scale bar
- North arrow
- Annotation and explanatory text
- Main map and supplementary map frames
A well-constructed layout ensures the map is not only informative but also visually coherent and easy to interpret.
Conclusion
Modern mapmaking is a multidisciplinary process that integrates data science, spatial analysis, and visual communication. From raw geographic data to a refined cartographic product, each step plays a vital role in transforming complex information into a map that informs, guides, and supports real-world decisions.