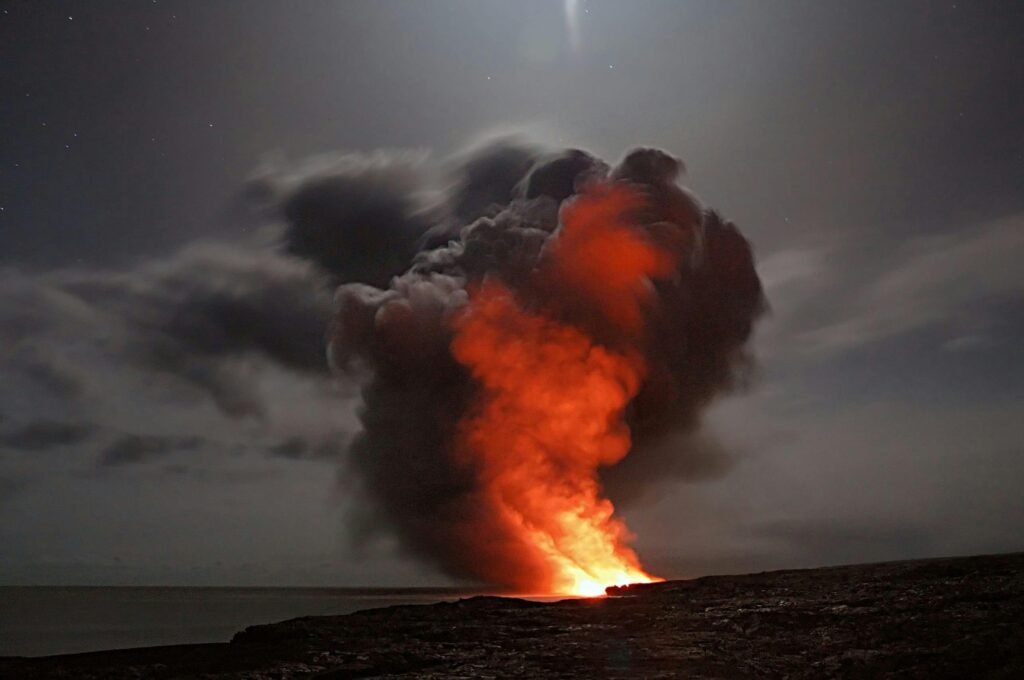
How GIS and spatial data are helping governments and communities mitigate the impact of natural disasters
Introduction: Disasters Are Inevitable. Catastrophe Isn’t.
As climate extremes intensify across the globe, natural disasters such as floods, earthquakes, wildfires, and hurricanes are becoming more frequent and severe. While these events cannot be prevented, their impact can be mitigated. One of the most powerful tools in achieving this is disaster risk mapping, especially when supported by Geographic Information Systems (GIS).
What Is Disaster Risk Mapping?
Disaster risk mapping is the process of using spatial data to visualize areas vulnerable to natural hazards. These maps integrate information on hazard likelihood, exposure, and vulnerability to support informed decision-making for disaster preparedness, response, and recovery.
Effective risk maps help answer critical questions:
a. Which populations are most at risk?
b. What infrastructure is exposed?
c. Where should emergency resources be allocated?
This geospatial insight enables more proactive and strategic planning.
The Role of GIS in Disaster Risk Management
GIS (Geographic Information Systems) is a core technology in modern disaster risk management. It enables users to visualize, analyze, and interpret spatial data to understand risk patterns and forecast disaster scenarios.
Key capabilities of GIS include:
a. Mapping hazard-prone zones
b. Modeling disaster impact scenarios
c. Guiding emergency response and evacuation planning
d. Monitoring environmental changes in real time
GIS turns data into action, helping governments and communities reduce disaster impacts before they occur.
Global Use Cases of Disaster Risk Mapping
Flood Risk Mapping
a. Netherlands utilizes LiDAR and high-resolution hydrological models to manage the constant threat of sea-level rise and river overflow.
b. Bangladesh leverages satellite rainfall data and topography models to predict flash floods and inform early warning systems.
c. United States (FEMA) provides public flood zone maps that influence real estate decisions and insurance policies.
Earthquake Risk Mapping
a. Japan uses nationwide seismic GIS data to guide building codes and support high-frequency earthquake drills.
b. Nepal adopted open-source mapping tools to assess infrastructure vulnerability and aid reconstruction following the 2015 earthquake.
c. California (USA) employs the “ShakeMap” system to display real-time shaking intensities and guide emergency response.
Wildfire Risk Mapping
a. Australia applies GIS to monitor vegetation fuel loads and forecast fire-prone areas based on heat and wind data.
b. Brazil (Amazon region) monitors wildfires using MODIS satellite imagery and integrates deforestation data to predict fire risks.
c. Canada and the US West Coast use integrated wildfire risk models for evacuation planning and sustainable forest management.
Why Risk Mapping Matters
Without access to risk maps, emergency responses may be delayed or misdirected, infrastructure may be built in vulnerable zones, and public awareness may remain dangerously low. Conversely, GIS-based disaster maps support:
a. Evidence-based urban planning
b. Strategic resource allocation
c. Targeted public education
d. Reduced economic and human losses
In short, risk mapping saves lives and protects livelihoods.
Supporting Global Resilience Frameworks
Disaster risk mapping is central to international efforts such as:
a. The Sendai Framework for Disaster Risk Reduction (UNDRR)
b. UN Sustainable Development Goals (SDG 11: Sustainable Cities, SDG 13: Climate Action)
c. COP Climate Adaptation Strategies
Spatial data is foundational to building climate-resilient cities and regions.
How to Engage With Risk Maps
Stakeholders at all levels can contribute to and benefit from risk mapping:
a. Access open platforms like UNDRR, Copernicus EMS, or ReliefWeb
b. Advocate for transparent and accessible hazard data
c. Participate in community-based mapping initiatives (e.g., OpenStreetMap)
d. Integrate spatial risk assessments into urban and infrastructure planning
Conclusion: Maps That Protect People and Places
Disaster risk maps are not just visual tools—they are instruments of resilience. In an era of increasing environmental volatility, GIS-powered risk mapping enables smarter decisions, safer infrastructure, and more prepared communities.
