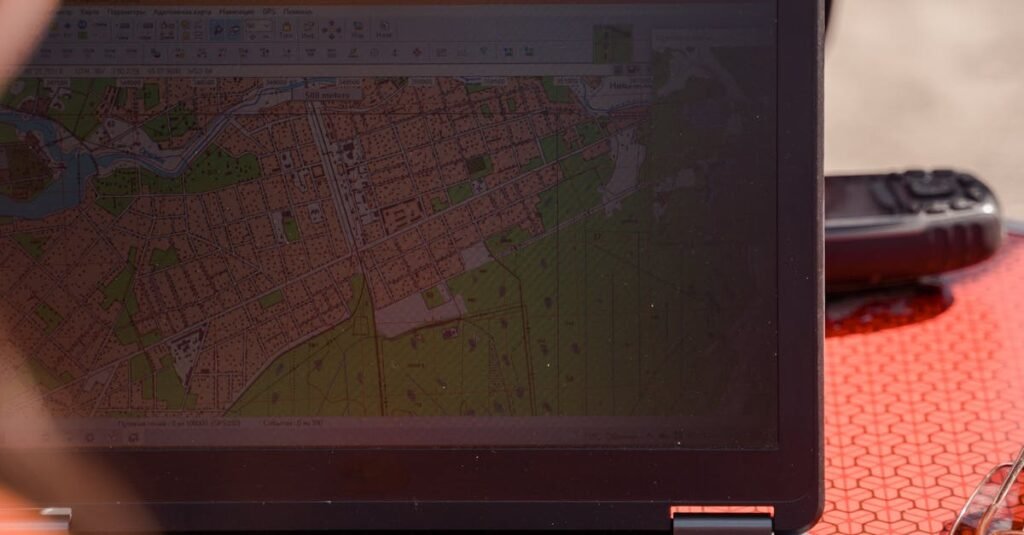
Spatial data is the backbone of mapping and geographic analysis, helping us visualize and understand the world around us. Whether you’re exploring road networks, analyzing land use, or studying satellite imagery, spatial data comes in two main types: vector and raster. Let’s break down what they are, how they differ, and when to use them!
What is Spatial Data?
Spatial data is any information that has a geographic reference, such as coordinates, addresses, or boundaries. It allows us to represent real-world features like roads, rivers, cities, and even environmental changes. From navigation apps to disaster management, spatial data plays a crucial role in how we interact with and understand our planet. Think of it as a way to bring geography to life!
Vector Data: Precision and Clarity
Vector data represents geographic features using points, lines, and polygons.
Points can mark specific locations like cities or landmarks.
Lines can represent roads, rivers, or railway tracks.
Polygons can define areas like parks, lakes, or administrative boundaries.
Vector data is highly precise and scalable, making it ideal for applications like urban planning, transportation networks, and boundary mapping. If you need clear, detailed representations, vector data is your go-to!
Raster Data: Detailed Visuals in Pixels
Raster data is made up of pixels or grids, where each pixel contains a value representing information like color, elevation, or temperature.
It’s perfect for capturing continuous phenomena, such as satellite imagery, weather patterns, or terrain models.
While raster files can be large, they provide incredible detail and are essential for environmental analysis, agriculture, and climate studies.
When you need to see the big picture, raster data delivers!
Vector vs. Raster: Which Should You Use?
The choice between vector and raster data depends on your needs:
Use Vector Data for:
Mapping administrative boundaries.
Creating road networks or transportation maps.
Representing precise, scalable features.
Use Raster Data for:
Analyzing satellite imagery or elevation.
Studying environmental changes like temperature or land cover.Capturing detailed visual information.
By understanding their differences, you can choose the right tool for your project!
Conclusion
Both vector and raster data are essential in the world of spatial analysis. Vector data offers precision and clarity, while raster data provides rich, detailed visuals. Whether you’re mapping city boundaries or analyzing satellite imagery, understanding these data types will help you unlock powerful insights about our world.
