
Understanding How Different Map Types Shape Spatial Interpretation
Maps are often perceived as objective representations of reality. However, in professional practice — whether in planning, environmental management, infrastructure, or spatial analysis — maps are interpretative tools. The same geographic area can appear fundamentally different depending on the type of map used.
Understanding this distinction is essential for making informed, data-driven decisions.
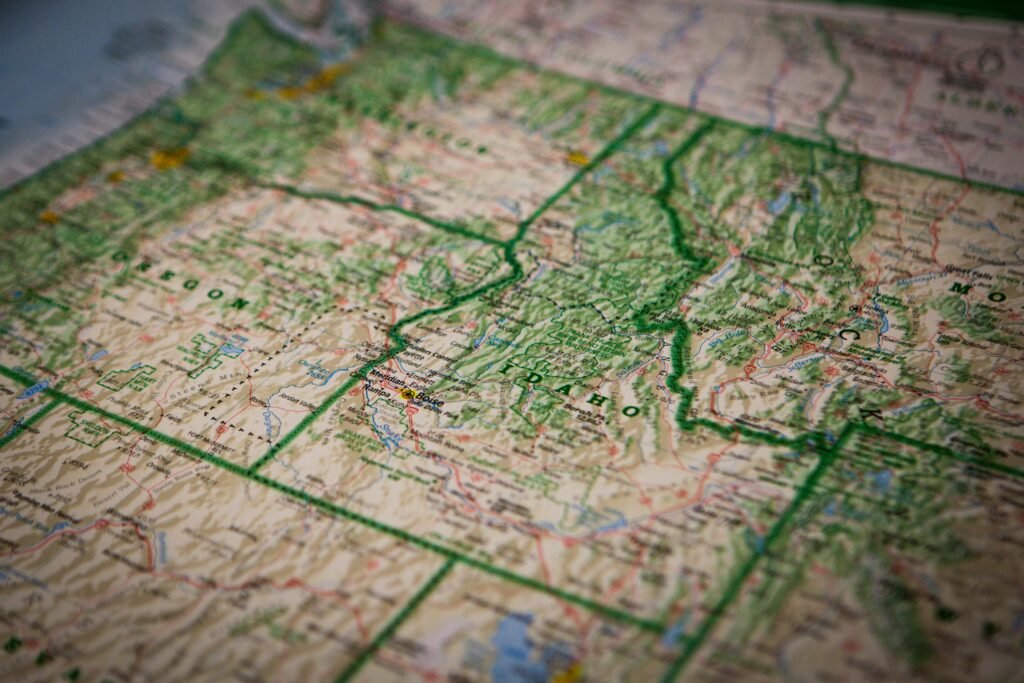
- Political Maps: Defining Jurisdictional Reality
Political maps emphasize administrative boundaries such as provinces, districts, and municipalities. They are essential for:
Governance and regulatory analysis
Land administration
Policy implementation
Public sector planning
However, political maps do not represent terrain, elevation, or physical characteristics. Their purpose is institutional clarity, not environmental accuracy.
For legal and policy-related decisions, political maps are indispensable. But they are insufficient for technical terrain analysis. - Topographic Maps: Reading the Shape of the Land
Topographic maps visualize elevation through contour lines, slope gradients, and relief shading. They reveal:
Mountain ridges
Valleys and drainage systems
Slope steepness
Terrain constraints
In engineering, mining, forestry, and infrastructure development, topographic interpretation is critical. A flat-looking region on a political map may contain steep gradients that significantly affect construction feasibility or risk exposure.
Topography transforms perception from two-dimensional boundaries into three-dimensional spatial understanding. - Thematic Maps: Data-Driven Storytelling
Unlike general-purpose maps, thematic maps focus on one specific variable, such as:
Population density
Rainfall distribution
Land use classification
Economic activity
Vegetation cover
These maps highlight spatial patterns and correlations rather than physical form or administrative borders.
For analysts and decision-makers, thematic maps provide insight into trends and concentrations. They help answer “where” questions related to data distribution — making them powerful tools for strategic planning. - Satellite Imagery: Observing Real Surface Conditions
Satellite imagery captures actual surface conditions at a specific moment in time. It reveals:
Forest cover
Urban expansion
Water bodies
Agricultural patterns
Land degradation
Unlike stylized cartographic maps, satellite imagery provides visual evidence. It supports monitoring, validation, and environmental assessment.
However, raw imagery often requires interpretation and processing before it becomes analytically useful. - Layered Mapping: The Professional Approach
Modern spatial analysis rarely relies on a single map type. Instead, professionals integrate multiple layers:
Administrative boundaries
Elevation data
Thematic variables
Satellite imagery
Through Geographic Information Systems (GIS), these layers interact to provide a comprehensive spatial model.
A boundary without terrain context is incomplete.
Terrain without socio-economic data is limited.
Imagery without classification lacks structure.
The real value emerges from integration.
Why Map Literacy Matters
Misinterpretation of map types can lead to flawed conclusions:
Selecting unsuitable land for development
Underestimating environmental risk
Overlooking regulatory constraints
Misreading data distribution
Before drawing conclusions, professionals must ask:
What type of map am I analyzing? What does it show — and what does it omit?
Every map tells a story.
But no single map tells the whole story.