
Topographic visualization plays a crucial role in spatial analysis, especially when trying to understand the terrain of a given area. One of the most visually intuitive tools for this purpose is the hillshade map. But what is it, and how does it help us interpret the Earth’s surface?
What Is a Hillshade Map?
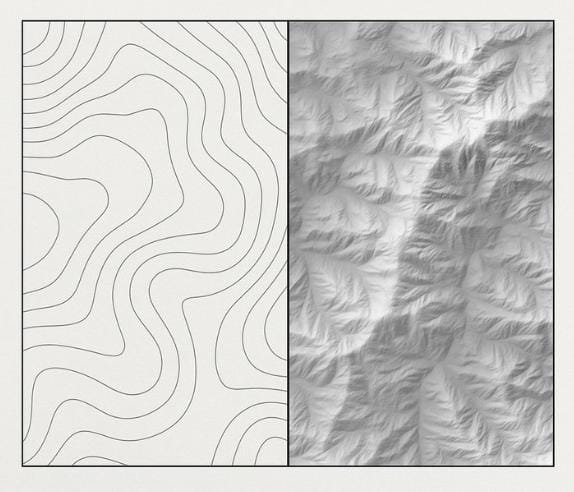
A hillshade map is a grayscale visual representation of terrain where the effects of illumination from a specific light source (typically the northwest) are simulated. By casting “shadows” based on elevation data, hillshade maps reveal slopes, ridges, and valleys—much like how mountains appear when sunlight hits them at a low angle.
How It Works
Hillshading uses a Digital Elevation Model (DEM) and simulates the sun’s position to compute brightness values across the terrain. Higher slopes facing the light source appear brighter, while opposing slopes appear darker. This contrast gives a three-dimensional look to otherwise flat maps.
Why It Matters
Hillshade maps are not just aesthetic tools—they provide critical context for:
- Land use planning
- Disaster risk analysis (e.g., landslide zones)
- Hydrological modeling
- Fieldwork preparation
The shading allows users to quickly identify steep terrain, depressions, and natural drainage patterns without needing to interpret complex contour lines.
How It’s Made
The process involves a few key steps:
- Obtain a DEM of your area of interest.
- Define the sun’s azimuth and altitude (commonly 315° and 45° respectively).
- Generate the hillshade layer using GIS software like QGIS or ArcGIS.
- Overlay the hillshade on other thematic maps for enhanced interpretation.
Tools You Can Use
- QGIS: Open-source GIS software with built-in hillshade generation tools.
- Google Earth Engine: Allows cloud-based hillshade rendering at scale.
- ArcGIS: Offers advanced shading customization and terrain analysis.
Illustrative Example
To visualize how hillshade works, imagine the ground surface being illuminated by a sun located in the northwest. Elevated terrain casts shadows to the southeast, revealing ridges and valleys through contrast. Even subtle terrain variations become visible, offering spatial awareness that flat maps cannot provide.
(Illustration suggestion: A diagram showing sunlight casting a shadow on hilly terrain; a hillshade map with northwest lighting effect.)
Conclusion
A hillshade map may seem like a simple grayscale layer, but it’s an incredibly powerful visual tool in geographic analysis. By simulating the interaction between sunlight and terrain, it helps us see the landscape in a new light—literally.